Notes from the desk
Three-Fund vs Golden Butterfly vs HFEA: What 15 Years of Backtesting Actually Shows
Three popular portfolios, 15 years of real backtest data, one uncomfortable truth: they all harvest the same equity risk premium. Leverage scales it. Complexity doesn't change it. True diversification requires fundamentally different risk premia.
The Boglehead three-fund portfolio. The Golden Butterfly. HFEA with 3x leverage. They sound like fundamentally different strategies. They have different numbers of holdings, different rebalancing logic, different philosophies. But when you backtest all three over the same 15-year period, their risk-adjusted returns land within a narrow band. The reason is simple and worth saying plainly: they're all built on the same foundation. The equity risk premium does the heavy lifting in every one of them, and no amount of slicing, dicing, or leveraging changes the underlying efficiency of that premium. It just scales it.
That's not a criticism. It's the most important thing to understand about portfolio construction. And it's why RiskHarvest focuses on building strategies from genuinely different risk premia, not rearranging the same one.
The three portfolios
Three-Fund (Boglehead): 60% US total stock market (VTI), 20% international stock (VXUS), 20% US bonds (BND). The passive investing benchmark. Jack Bogle's philosophy distilled to three ETFs.
Golden Butterfly: 20% US total stock (VTI), 20% US small-cap value (VBR), 20% US large-cap growth (IUSG), 20% long-term Treasuries (TLT), 20% short-term Treasuries (SHY). Designed by Tyler at Portfolio Charts to perform across "economic seasons," weighting five assets equally.
HFEA (Hedged Fun Early Asset): 55% UPRO (3x leveraged S&P 500), 45% TMF (3x leveraged long-term Treasuries). A leveraged variant of the 60/40 concept originated on the Bogleheads forum (the Hedgefundie thread) and widely discussed on r/LETFs.
All three were backtested using daily split- and dividend-adjusted prices from Tiingo, rebalanced quarterly (every 63 trading days), with 1 basis point round-trip cost per trade. The fair comparison period is June 2011 through July 2026, the longest window where all three portfolios have live ETF data.
The numbers (2011 to 2026)
| Portfolio | CAGR | Volatility | Sharpe | Max Drawdown | Calmar | $1 grew to |
|---|---|---|---|---|---|---|
| Three-Fund (60/20/20) | 10.30% | 13.81% | 0.78 | -28.7% | 0.36 | $4.37 |
| Golden Butterfly | 9.43% | 10.69% | 0.90 | -22.2% | 0.42 | $3.88 |
| HFEA (3x leveraged) | 20.62% | 29.97% | 0.78 | -67.9% | 0.30 | $16.81 |
| 60/40 Baseline | 9.45% | 10.81% | 0.89 | -22.7% | 0.42 | $3.89 |
All portfolios rebalanced quarterly, 1bp round-trip costs. Data: Tiingo via research-service backtest engine.
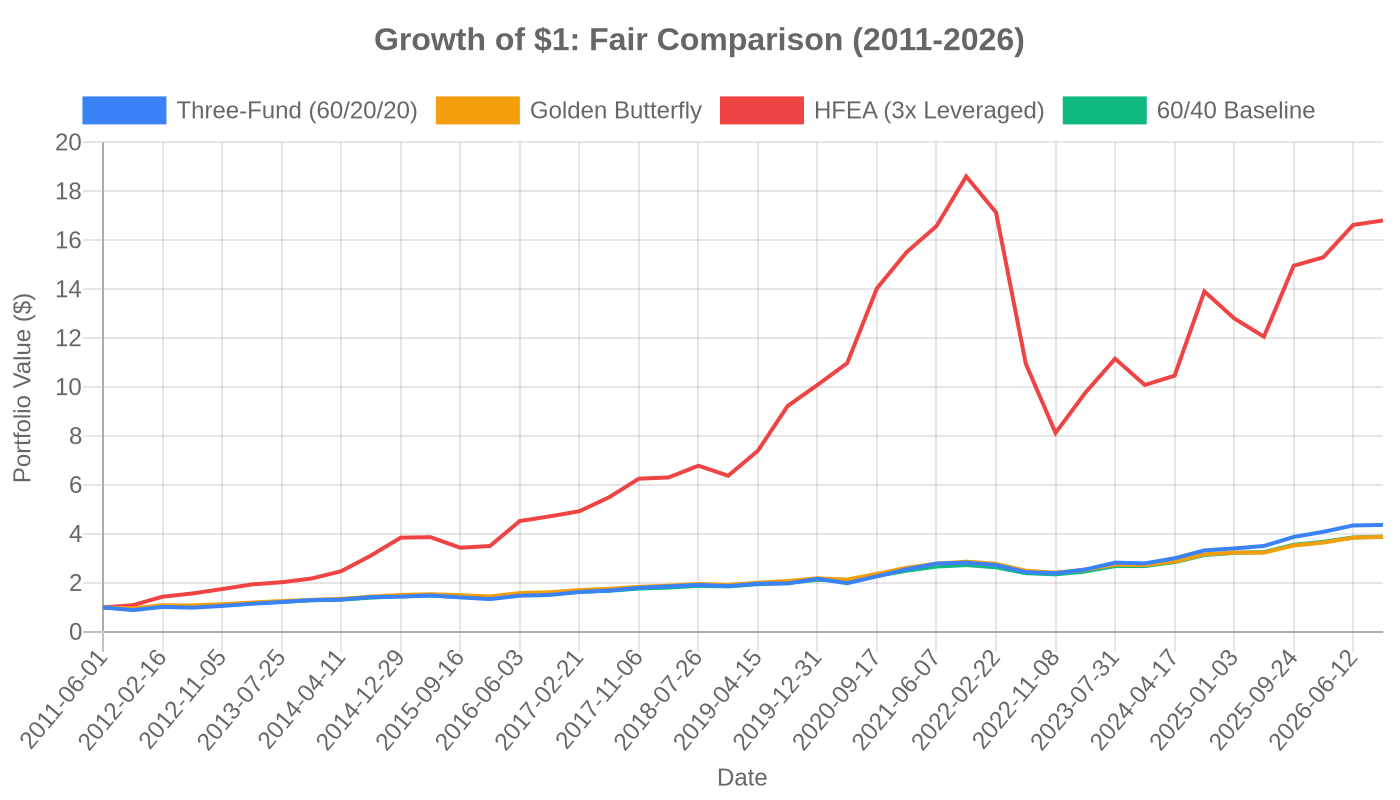
What the numbers say
Three things jump out, and none of them is what the construction emphasizes.
1. The Three-Fund wins on raw return, but only because it holds more equity. Three-Fund delivered 10.3% annualised versus Golden Butterfly's 9.4%, which is exactly what you'd expect from an 80% equity portfolio competing against a 60% equity one. But the Golden Butterfly got there with 23% less volatility (10.7% vs 13.8%) and a shallower drawdown (-22.2% vs -28.7%). That's why its Sharpe ratio is higher: 0.90 versus 0.78. You took less risk to get slightly less return, but the return per unit of risk was better.
2. The Golden Butterfly is almost identical to a plain 60/40 portfolio. This is the finding that should make someone paying for a five-asset portfolio sit up. The 60/40 baseline (60% VTI, 40% BND) delivered 9.45% CAGR, 0.89 Sharpe, and -22.7% drawdown. The Golden Butterfly delivered 9.43% CAGR, 0.90 Sharpe, and -22.2% drawdown. Those numbers are indistinguishable at this sample length. All the small-cap value, large-cap growth, and double-duration Treasury slicing added approximately zero risk-adjusted value over a plain 60/40.
3. HFEA's leverage changes the destination, not the efficiency. HFEA turned $1 into $16.81 in fifteen years. That's a 20.6% CAGR, double the Three-Fund's return. But look at the risk metrics: 30% annualised volatility, a -67.9% maximum drawdown, and a Sharpe ratio of 0.78 — identical to the Three-Fund. The Calmar ratio (CAGR divided by max drawdown) is actually the worst of the four portfolios at 0.30. Leverage scaled the returns, scaled the drawdowns, and left the return-per-unit-of-risk unchanged.
Why they all converge: the equity risk premium is the engine
Here's the part that matters most.
The Three-Fund portfolio holds 80% equities. The Golden Butterfly holds 60% equities. The 60/40 holds 60% equities. HFEA holds 55% in 3x leveraged equities, which is effectively 165% equity exposure. The rest is bonds in all four cases.
What drives returns in all four portfolios? The equity risk premium. What drives drawdowns? Equity drawdowns, amplified or dampened by the bond allocation. What drives the Sharpe ratio? The ratio of equity premium to equity volatility, which is roughly constant regardless of how many ETFs you slice it into.
The Golden Butterfly's five assets sound more diversified than a 60/40's two. But 60% of the Golden Butterfly is still equity exposure (VTI, VBR, IUSG), and 40% is Treasury exposure (TLT, SHY). The duration differs, the market cap differs, the factor tilts differ — but the underlying risk premia are the same. You're harvesting equity premium and term premium in both cases. The Sharpe ratios confirm this: 0.89 for 60/40, 0.90 for Golden Butterfly. The five-asset construction didn't add a new premium. It just rearranged the same two.
This is the uncomfortable truth about portfolio construction: no matter how you diversify within the equity-and-bond universe, you're carrying the same underlying risk factors. The labels change. The Sharpe doesn't.
What leverage actually does
HFEA makes the leverage story explicit, but the lesson applies to any leveraged strategy. The math is simple and worth walking through.
If you take a strategy with a Sharpe ratio of 0.78 and apply 3x leverage, you get a strategy with a Sharpe ratio of 0.78. Leverage scales expected returns and volatility by the same factor. The risk premium per unit of risk is unchanged. What changes is the absolute level of both: returns go up, drawdowns go up, and the path between them gets more violent.
HFEA's -67.9% drawdown is the real cost of its 20.6% CAGR. At the worst moment in 2022, someone holding HFEA saw two-thirds of their portfolio value evaporate. The strategy recovered, but the path required staying invested through a drawdown that deep. Historically, most investors don't. They sell at the bottom, convert a paper loss into a real one, and never capture the recovery that the backtest shows.
Leverage doesn't create a better risk-return tradeoff. It creates a different point on the same risk-return frontier: same Sharpe, deeper drawdown, higher absolute return. The Sharpe is identical to the unleveraged Three-Fund. The Calmar is worse.
The takeaway
If you take one thing from this comparison: the Sharpe ratio of a portfolio is determined by the risk premia it carries, not by the number of assets it holds. Three-Fund, Golden Butterfly, and 60/40 all carry the equity risk premium as their primary engine. They produce similar risk-adjusted returns because they're harvesting the same premium. HFEA carries the same premium at 3x leverage. It produces 3x the return with 3x the drawdown and the same Sharpe.
The portfolios sound different. The portfolios are different in construction. But the nature of what they harvest is similar. Diversifying across asset labels within the equity-and-bond universe doesn't diversify the underlying risk factor. It just repackages it.
If rearranging equity and bond exposure doesn't change the risk-adjusted return, and leverage just scales the same risk, then what does actually move the Sharpe ratio? Adding genuinely different risk premia. Not different slices of equity. Different sources of return that are structurally uncorrelated with the equity risk premium.
Carry, volatility risk premia, momentum, and term structure are risk premia with return drivers that differ structurally from the equity risk premium, not just in label. A carry strategy earns the difference between funding rates and asset yields. A volatility strategy earns the difference between implied and realised volatility. These are different risk transfers with different return drivers, not different weightings of the same stock-and-bond mix.
The comparison in this article shows why that distinction matters. If you compare three strategies that all carry 60 to 80 percent equity risk, you get three nearly identical Sharpe ratios. If you compare a strategy built on equity risk premium to one built on, say, the volatility risk premium, the Sharpe ratios can actually diverge because the return drivers are different. That's the frontier where risk-adjusted returns improve, not from more asset labels but from fundamentally different sources of return.
True diversification, the kind that actually moves the Sharpe ratio, requires strategies whose returns come from structurally different sources. That's the universe RiskHarvest operates in. Not a different weighting of stocks and bonds, but a different set of risk premia entirely. We've written about harvesting risk premia and why diversification only works when the assets are truly uncorrelated.
A note on the backtest
Every backtest has limitations, and the details here can be reduced to a few honest caveats.
Survivorship bias: The ETFs used are all currently listed funds. Delisted or merged funds are not in the universe, which makes backtested returns look slightly better than real-time experience.
One period: The fair comparison covers June 2011 to July 2026. It includes a historic bull market, a pandemic crash and recovery, and a 2022 bear market, but not the 2008 financial crisis or the 2000-2003 dot-com collapse. A different period could produce different relative rankings, particularly for drawdowns.
Costs: We charged 1 basis point per round-trip trade. HFEA's leveraged ETFs carry internal expense ratios around 0.91% (UPRO) and 0.97% (TMF), which are deducted from NAV before the price series and so are implicitly included. Other ETFs have expense ratios of 0.03 to 0.07%, also included in NAV.
Rebalancing frequency: All portfolios were rebalanced quarterly. Different frequencies would produce different results, particularly for HFEA where the rebalancing premium is a meaningful part of the thesis.
VXUS inception: The Three-Fund's international component launched in June 2011, which constrains the fair comparison period. A longer history using a proxy might tell a different story.
Educational, not financial advice. This analysis compares historical performance of portfolio constructions. It is not a recommendation to buy, sell, or hold any security or strategy. Past performance does not predict future results.